
Waste management strategies involves management of waste by not generating it at first place. if prevention and mitigation of waste is not possible, then go down the hierarchy of waste management of reusing, recycling, waste to energy or disposing the waste in landfills
Countries and cities urbanise, develop economically, and the population increases leading to more waste. Urbanization is a trend that is expected to continue. By 2050 two-thirds of the global population will live in towns and cities. More than half the projected increase in global population up to 2050 will be concentrated in eight countries such as the Democratic Republic of the Congo, Egypt, Ethiopia, India, Nigeria, Pakistan, the Philippines and the United Republic of Tanzania. The total quantity of waste generated in low-income countries is expected to increase by more than three times by 2050. The East Asia and Pacific region is generating most of the world’s waste, at 23 percent, (468 million tons) of the annual waste, equivalent to the weight of 46,337 Eiffel Towers (10,100 tons) or 4.5 million blue whales (105 tons). The Middle East and North Africa region is producing the 6 percent of the global waste
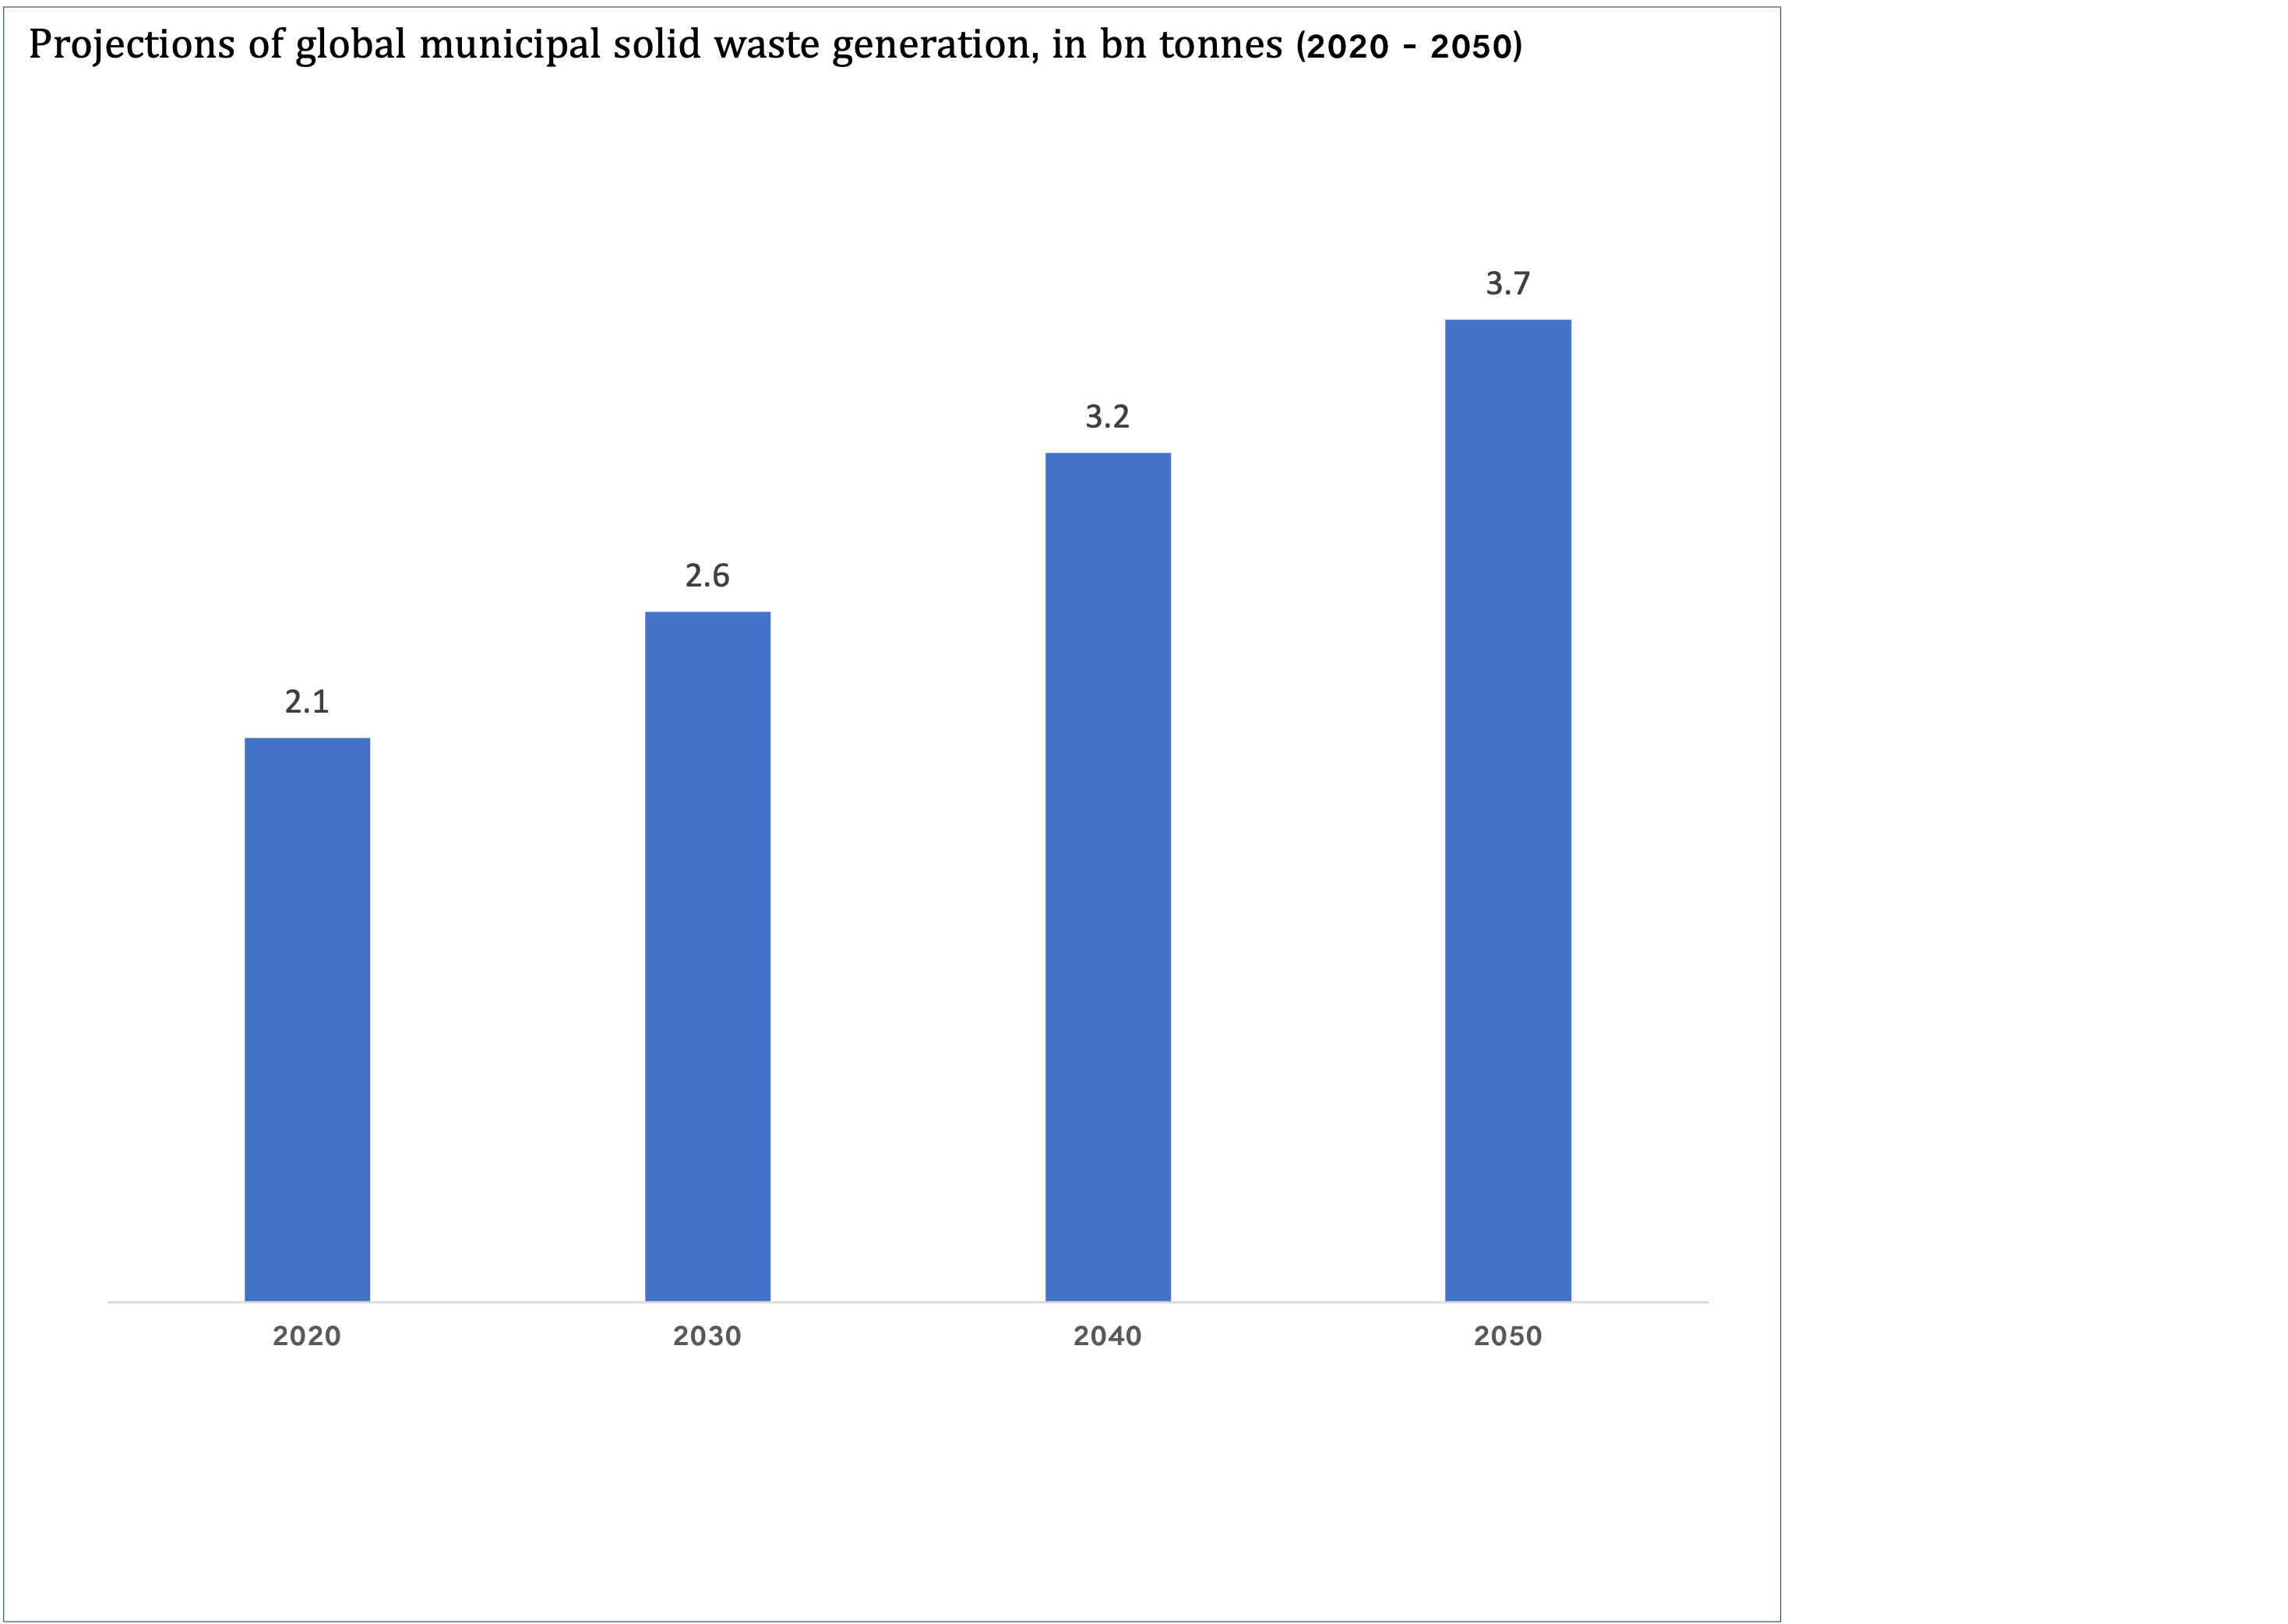
In 2020, global MSW generation is estimated to have been 2.1 billion tonnes per year. World Bank estimates Owing to a combination of economic and population growth, it is projected to increase by 56 per cent to 3.8 billion tonnes by 2050
Some 2.7 billion people do not have their waste collected: 2 billion in rural areas and 700,000 in urban areas. This amounts to 540 million tonnes of MSW, or around 27 per cent of the global total, not being collected
Waste collection services varies within and between regions. In higher-income regions more than 99.9% MSW is collected, while less than 40 per cent of MSW is collected in lower-income countries. For example, the regions with the lowest collection coverage (Oceania, Central and South Asia, Sub-Saharan Africa) also have the lowest urbanisation rates
The global share of uncontrolled MSW disposal (dumping and open burning is projected to increase from 38 per cent in 2020 to 41 per cent by 2050. However, when projected MSW growth is factored in, this proportional increase will mean an almost two-fold increase in uncontrolled MSW, from 806 million tonnes in 2020 to 1.6 billion tonnes in 2050
Better waste management could mitigate 15%- 25% of global CHG emissions
The Circular Economy scenario will require economic growth to be entirely decoupled from resource use, with government policies and producer actions fully aligned. Left unaddressed, the total global cost of municipal solid waste in 2050 is projected to reach US$640.3 billion